
Analysis Tools
After a task is finished, you can click the "View" button to enter the task result page. It includes a list of molecules and basic information about the task:
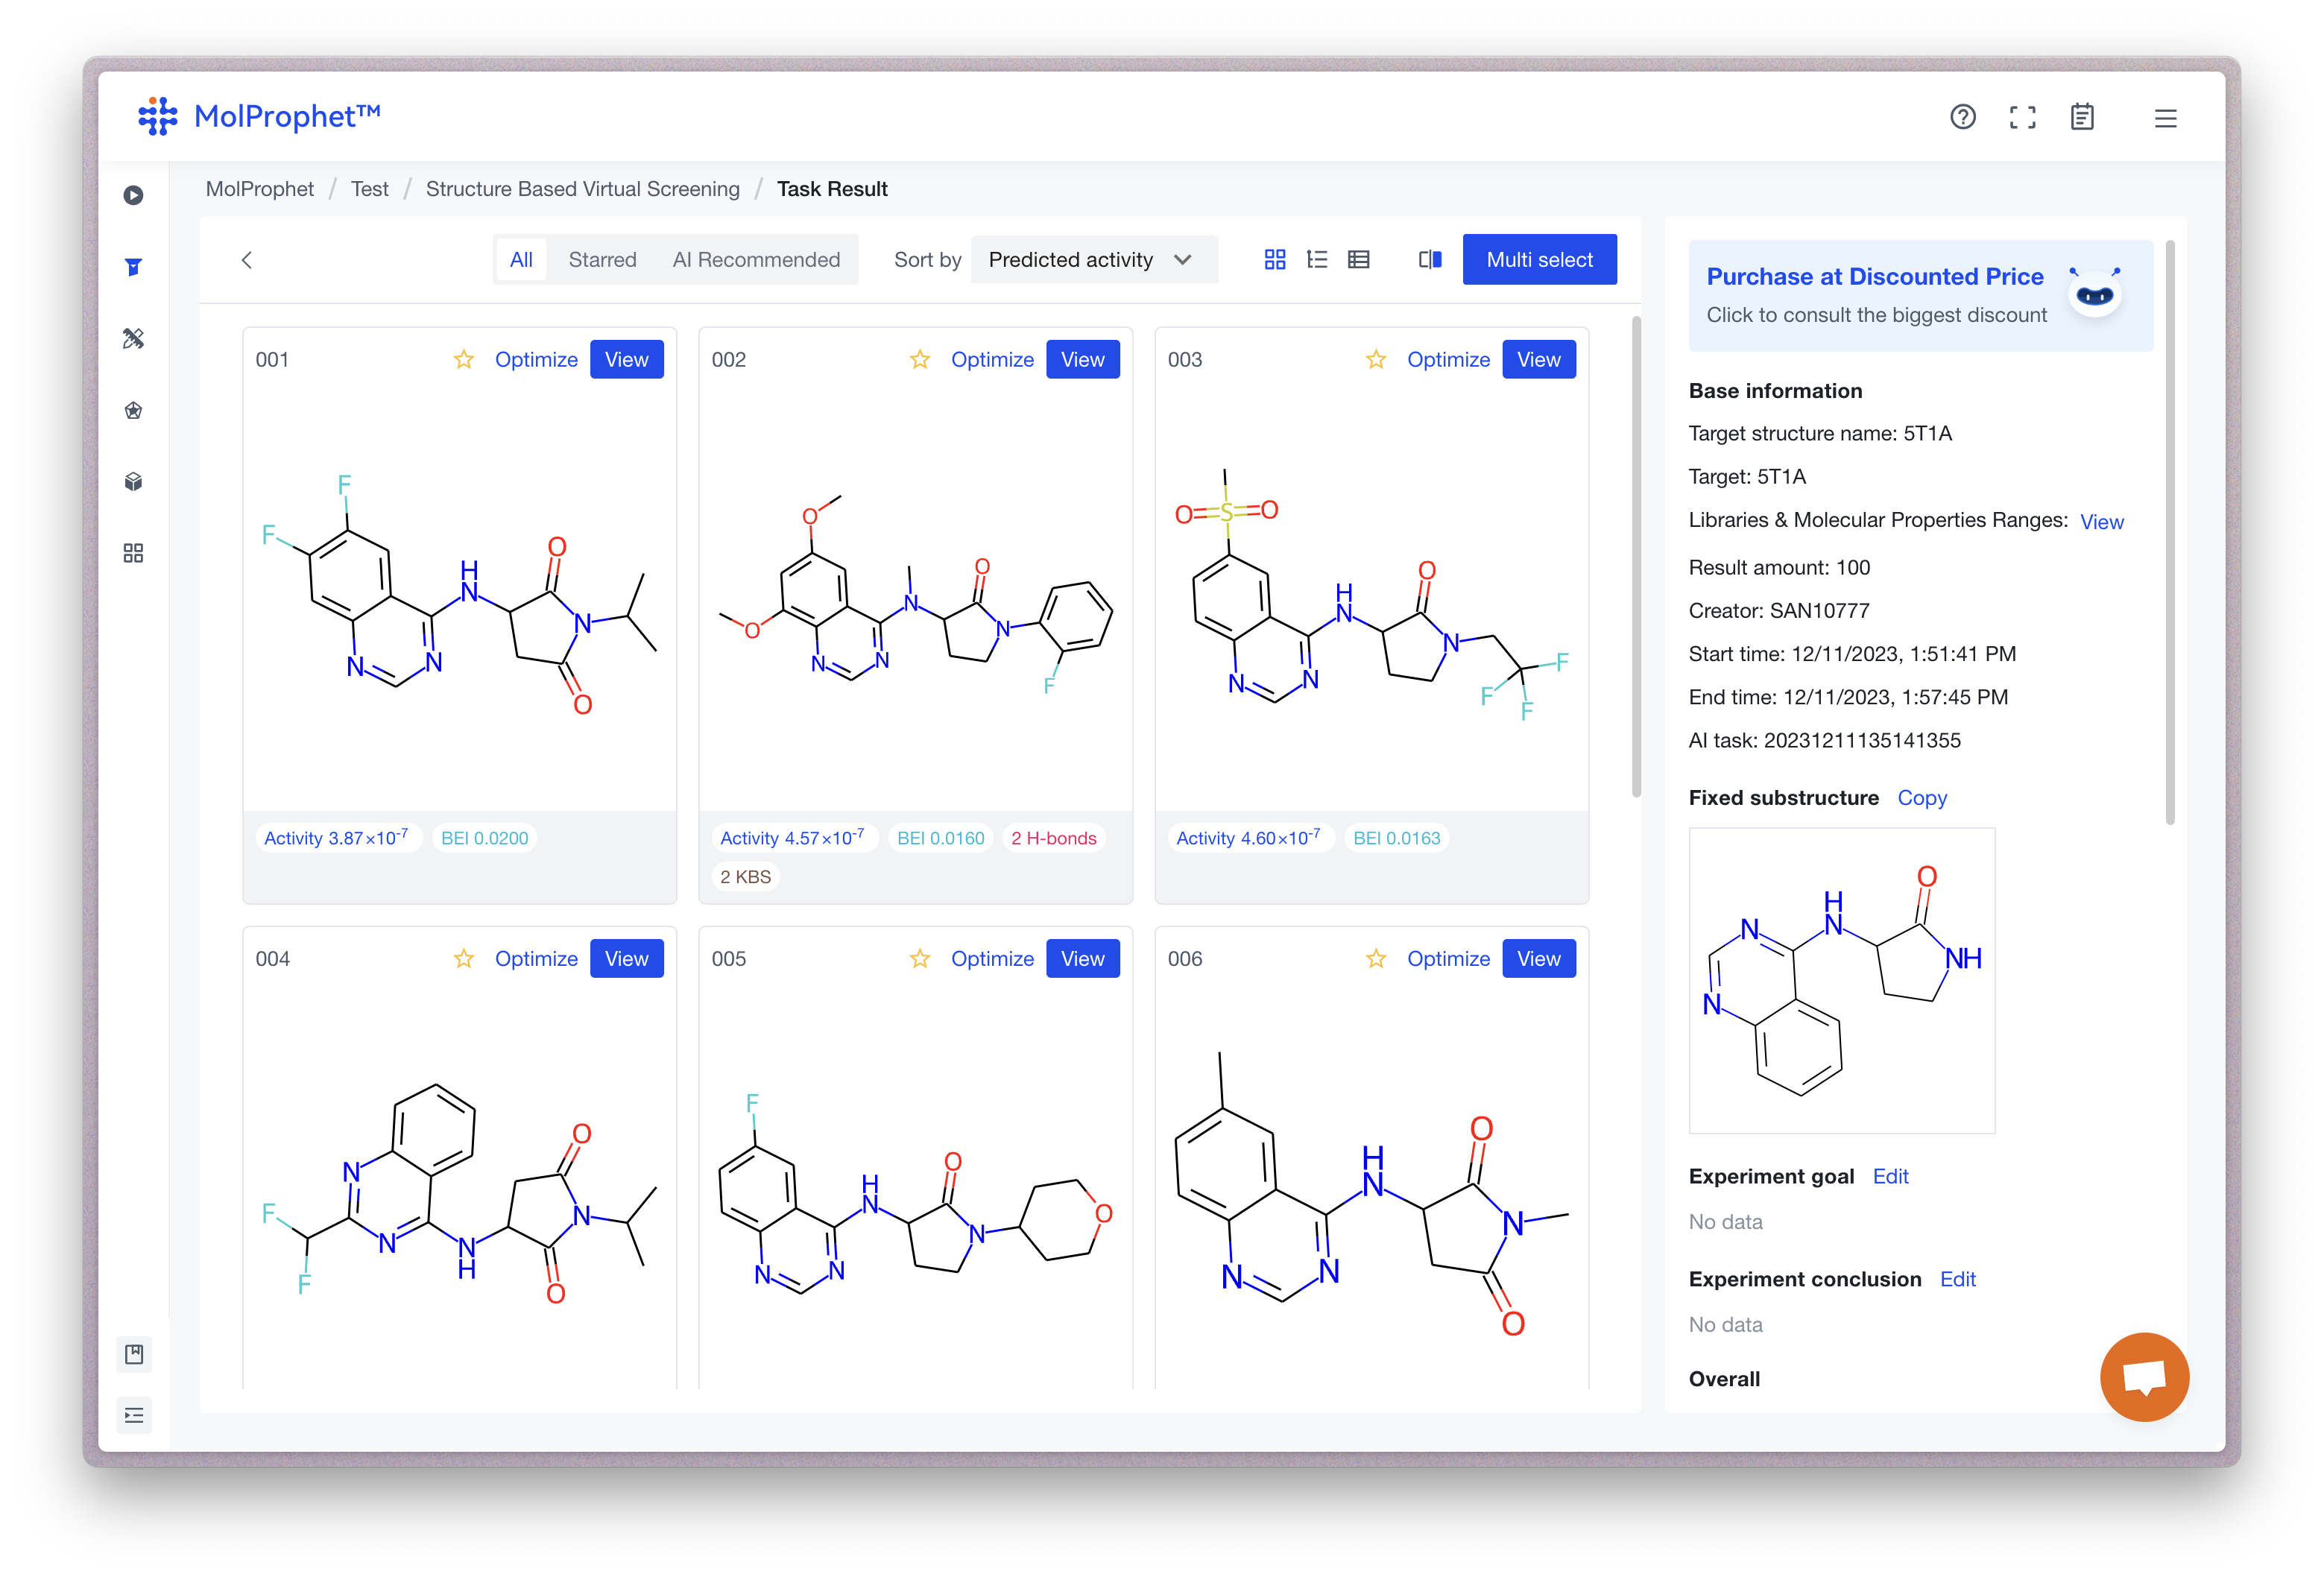
For each result molecule, you can click the "View" button and access analysis tools we provided to access crucial data including 3D structure, binding mode, drug-likeness, synthetic pathway, and more.
Oral Bioavailability Assessment and Structural Alerts
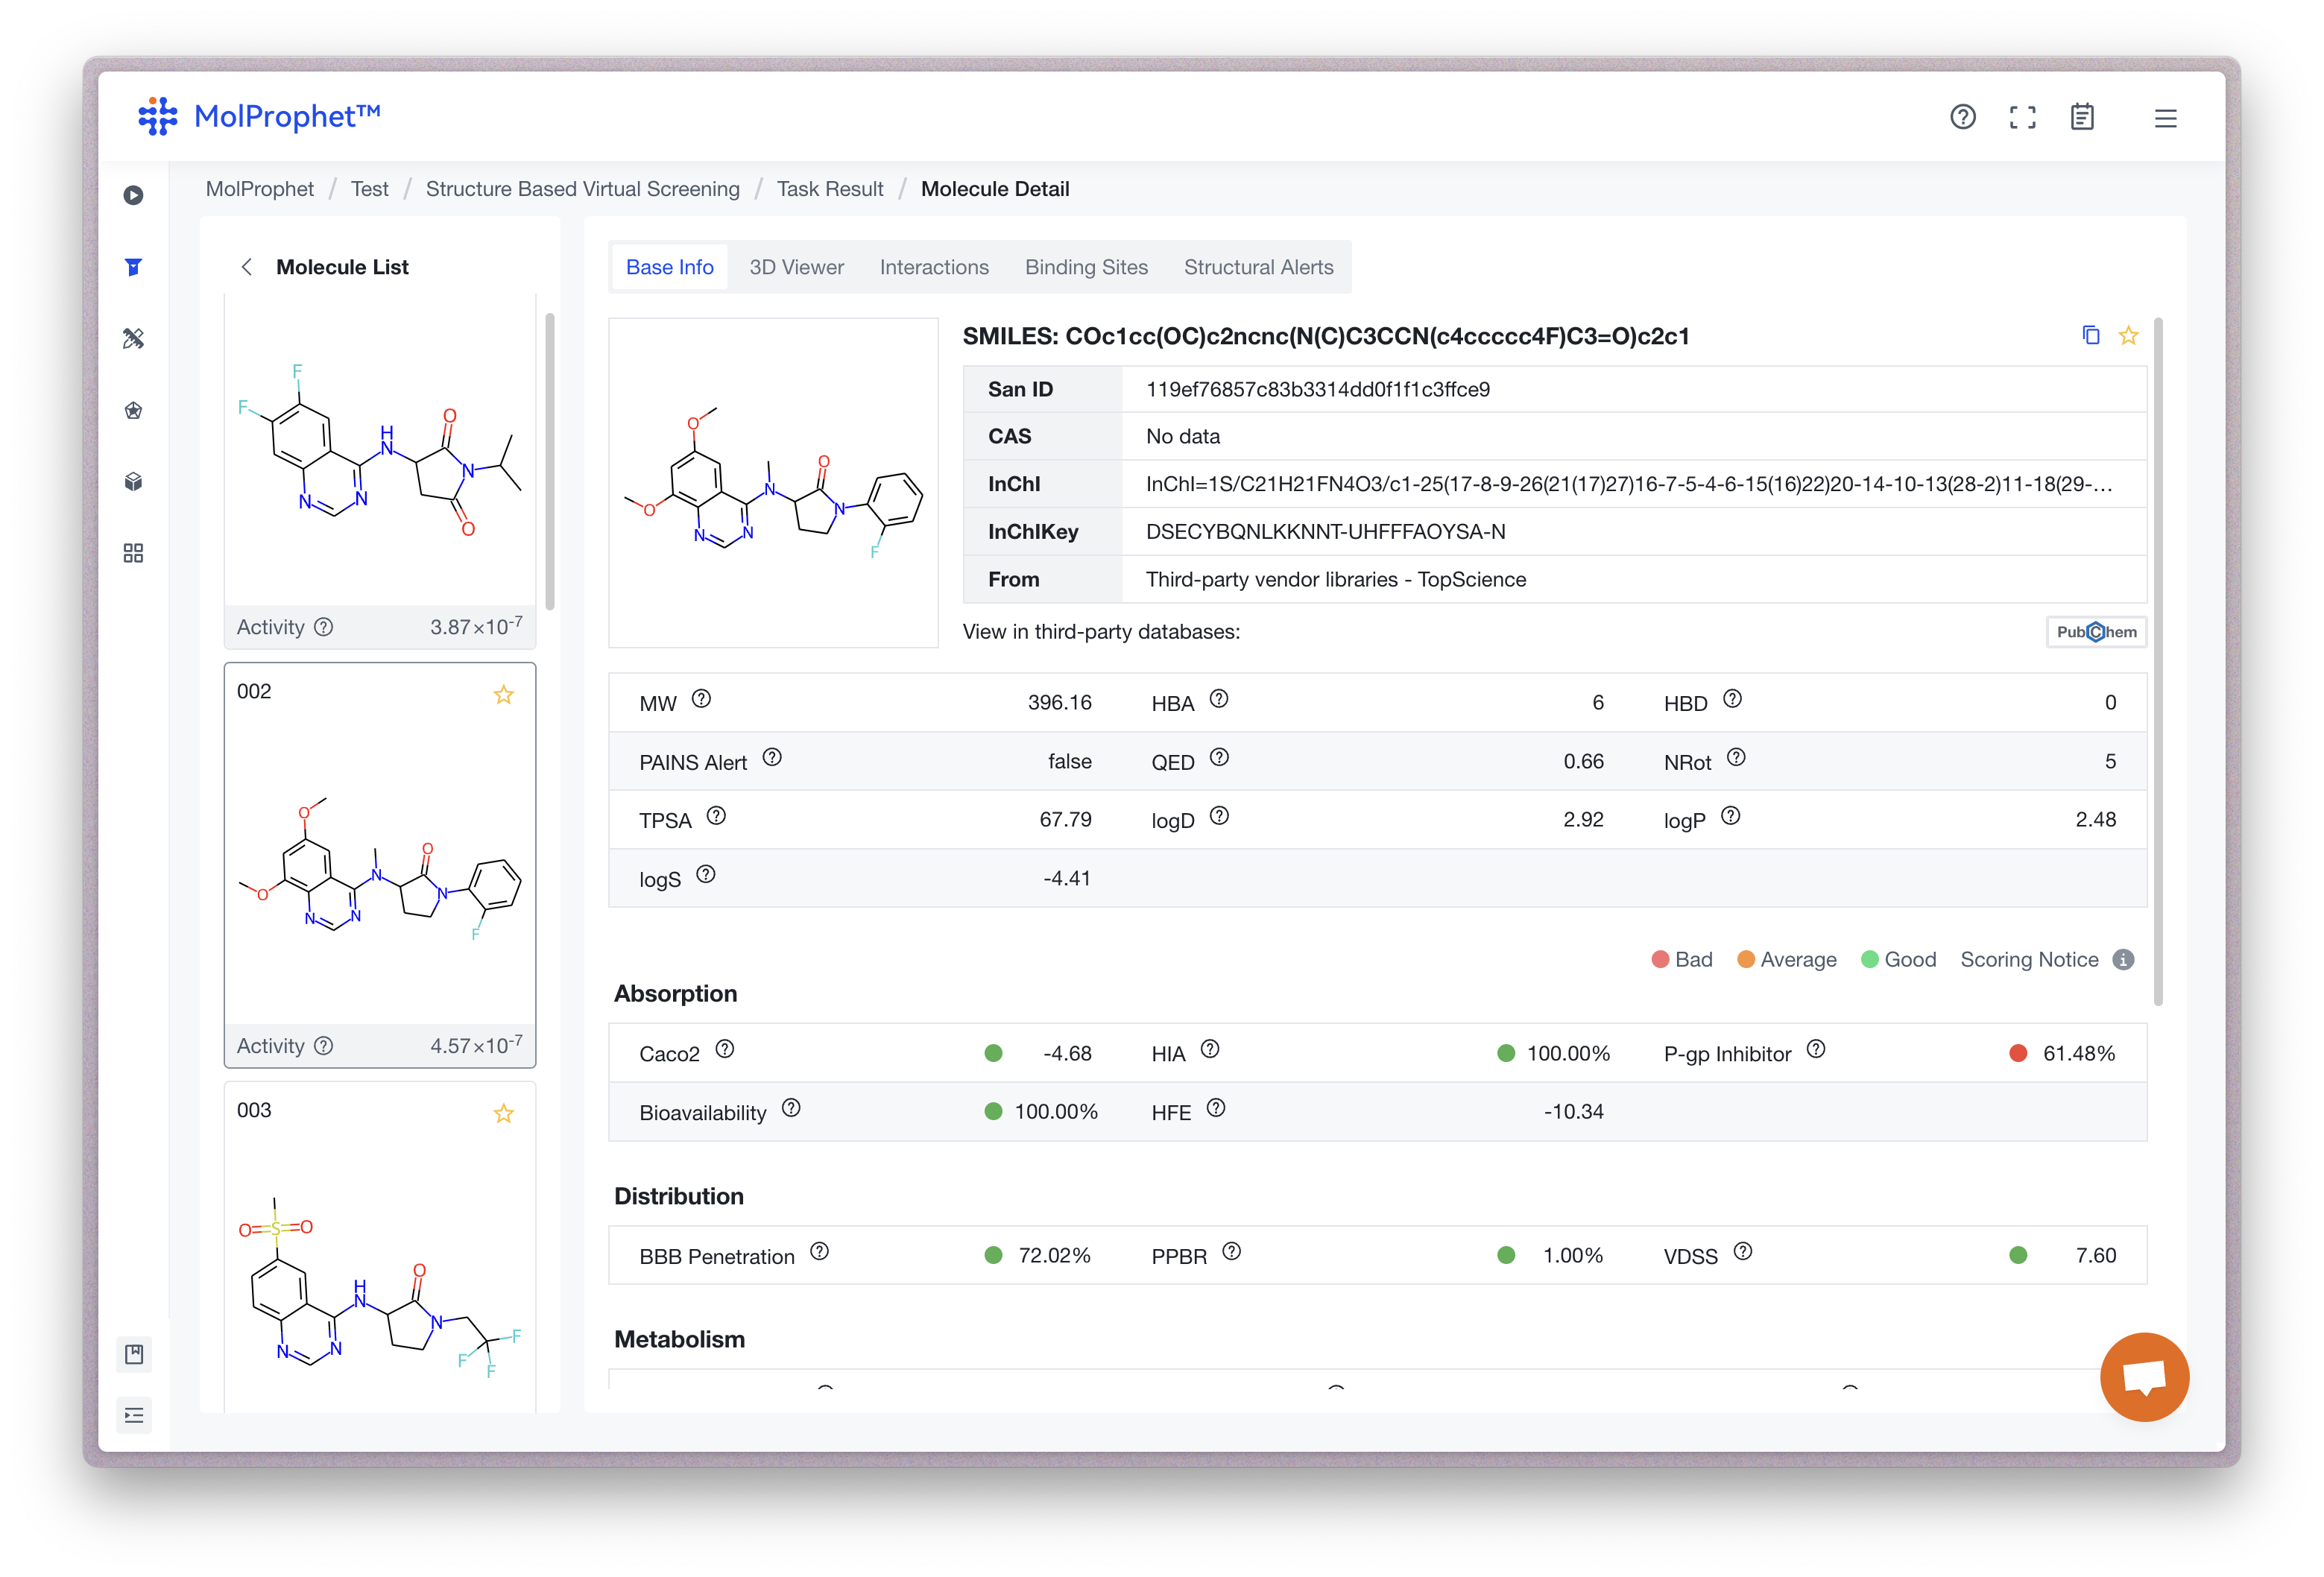
During small molecule drug design, the Lipinski’s rule of 5 is often used to evaluate oral bioavailability of a compound. As shown below, the platform evaluates the compound by physicochemical properties such as molecular weight, topological polar surface area, lipophilicity, and hydrogen bond donors/acceptors.
In addition to the rule of 5 evaluation, it is important to identify and address structural alerts in the proposed drug molecule. Structural alerts are functional groups or substructures that have been associated with toxicity or poor bioavailability in previous drug development studies. By identifying and removing structural alerts in the design phase, drug discovery teams can increase the chances of success in clinical trials and decrease the risk of late-stage attritions due to safety or efficacy concerns. Here, we provide BMS Rule, Chelator Rule, PAINS Rule, Genotoxic Carcinogenicity Rule, NTD Rule, and SureChEMBL Rule structural alerts.
ADMET Prediction
ADMET prediction plays a vital role in predicting the safety and efficacy of a drug before it is tested in clinical trials, which helps to reduce the risk of drug failure and ensures patient safety.
In the platform, Absorption is assessed by Caco2, Human Intestinal Absorption (HIA), and P-glycoprotein (P-gp) Inhibitor. Bioavailability is assessed by Hydration Free Energy (HFE), Distribution, Blood-Brain Barrier (BBB) Penetration, Plasma Protein Binding Ratio (PPBR), and Volume of Distribution (VDSS). Metabolism is assessed by CYP2D6 Inhibitor, CYP3A4 Inhibitor, CYP2C9 Inhibitor, CYP2D6 Substrate, CYP3A4 Substrate, CYP2C9 Substrate, CYP2C19 Inhibitor, and CYP1A2 Inhibitor. Excretion is assessed by Half Life (hour) and Clearance (mL/min/g). Toxicity is assessed by hERG, Drug-induced Liver Injury (DILI), Aryl hydrocarbon Receptor (NR-AhR), Carcinogencity, Median Lethal Dose (LD50), Respiratory toxicity, and Eye Corrosion.
Binding Mode Assessment
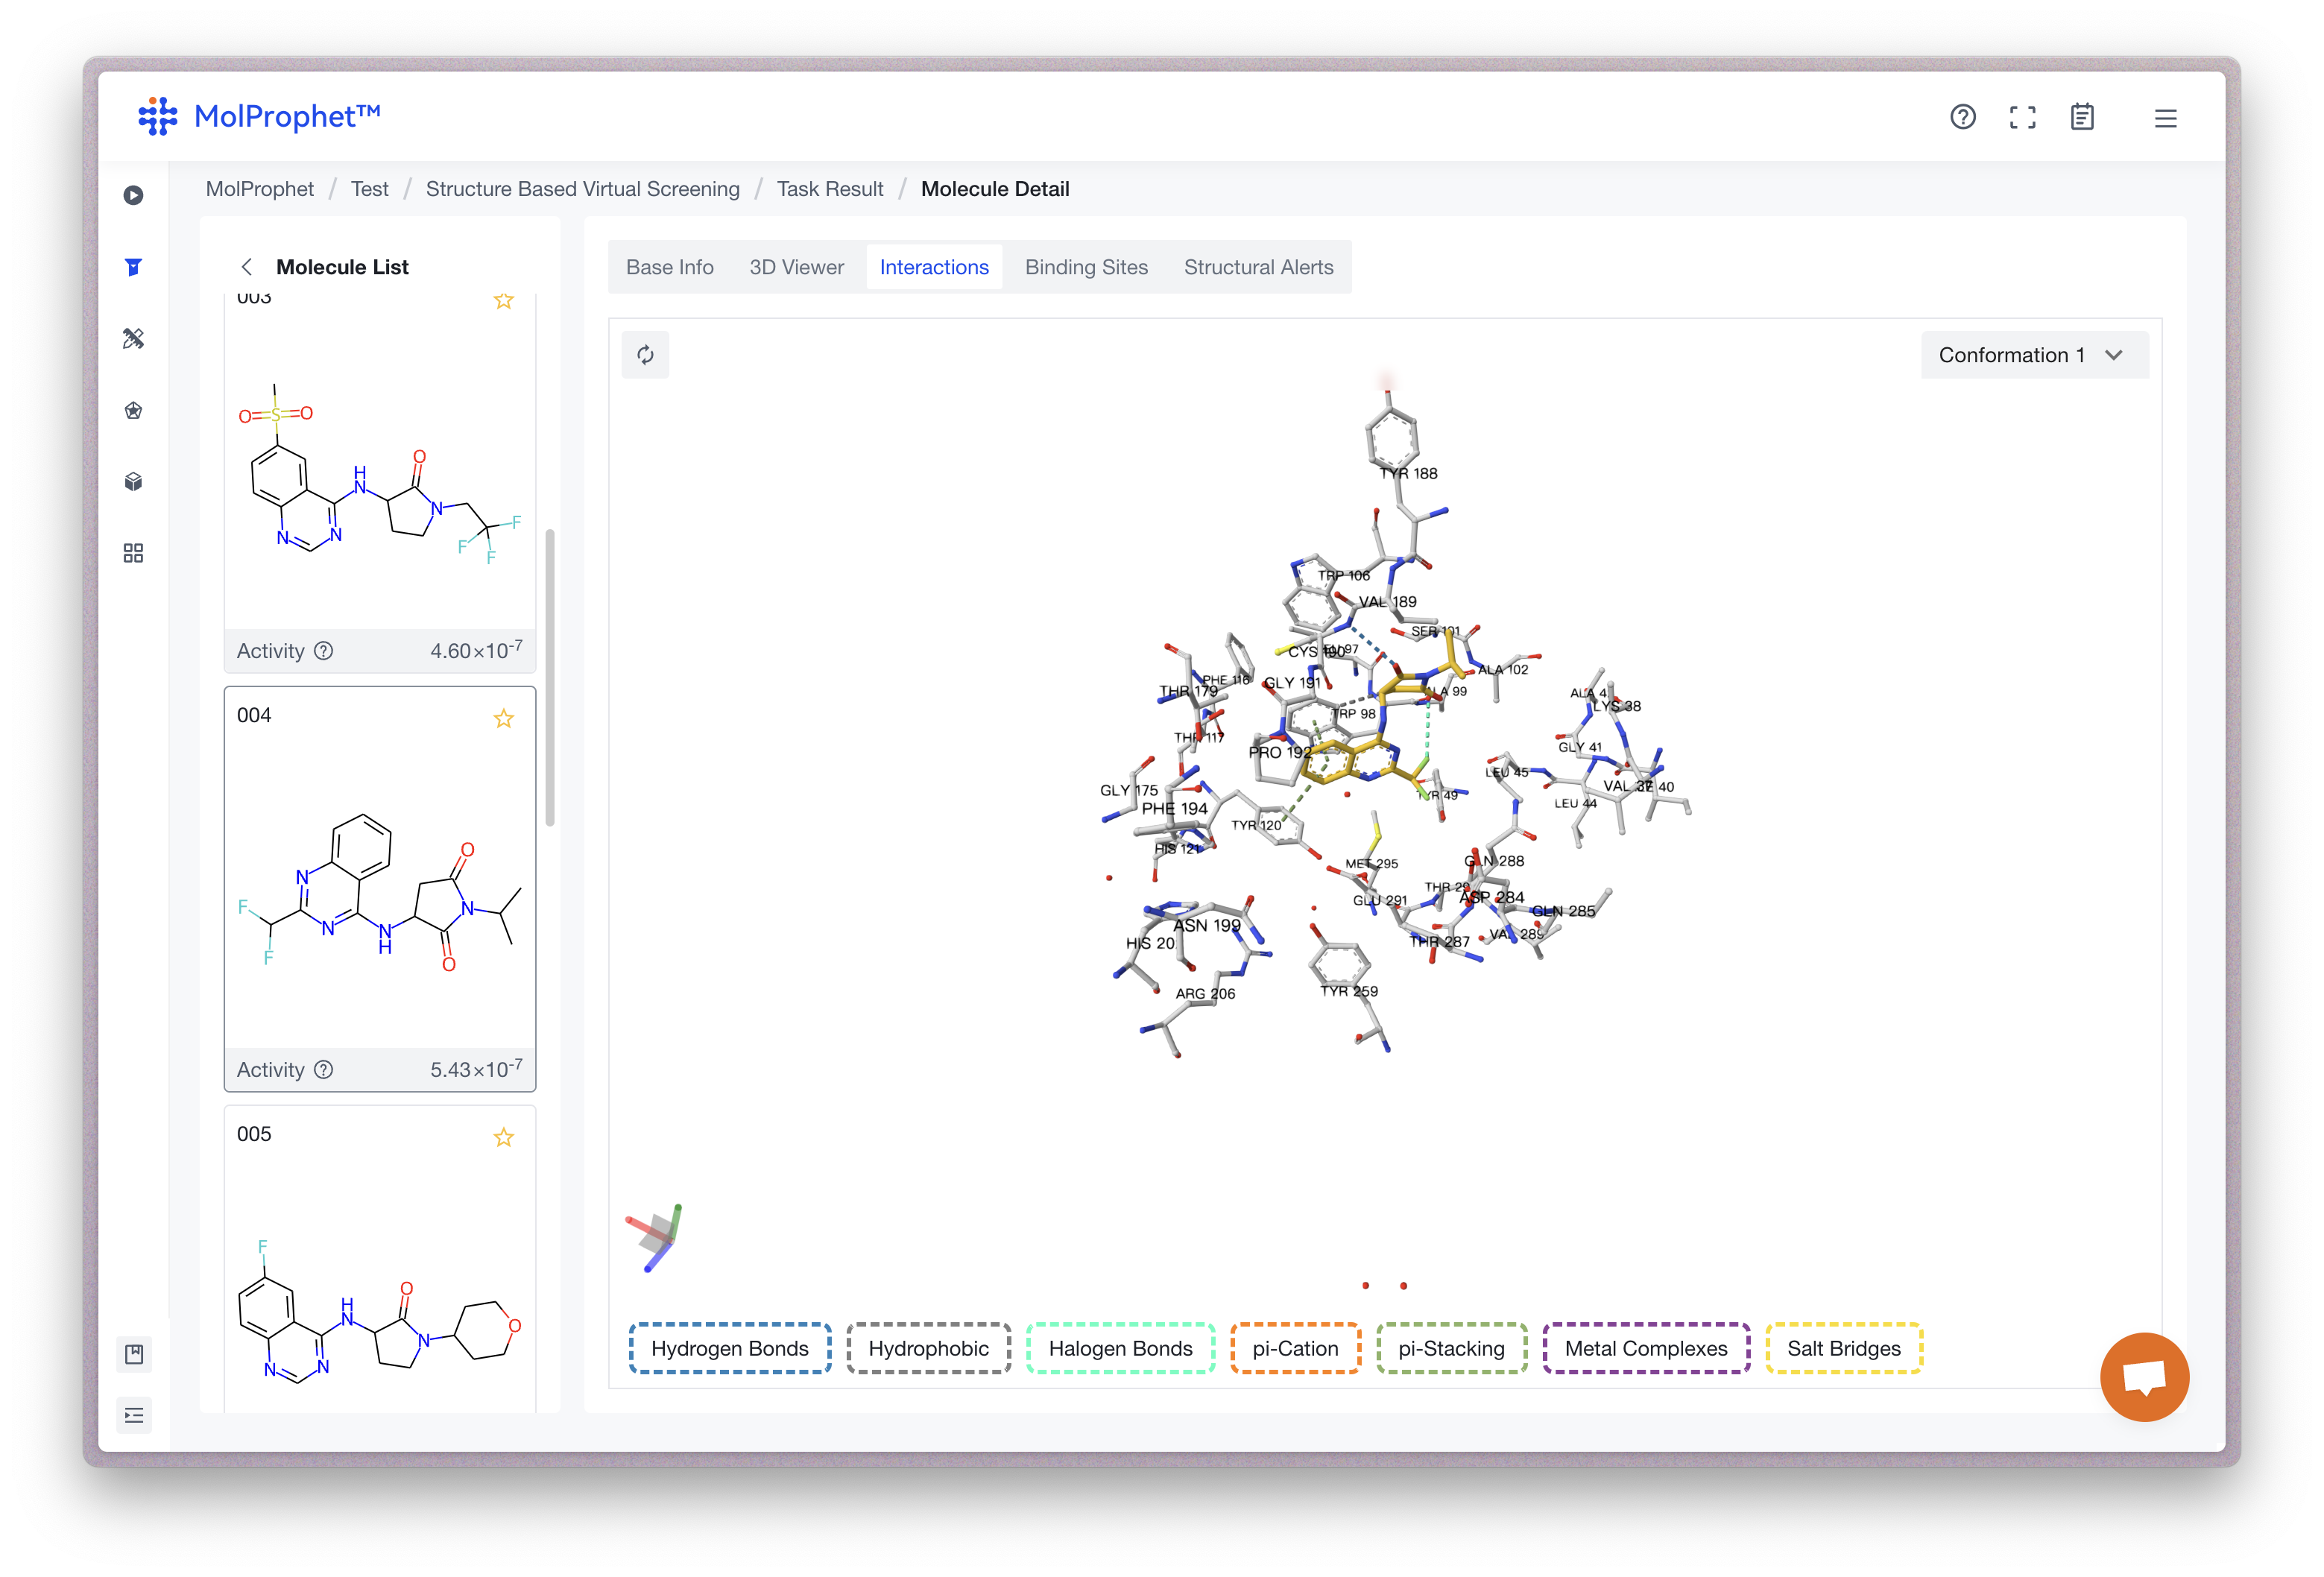
To rapidly analyze the interaction characteristics between molecules and ligands, the interactions present in different ways:
A 3D viewer of protein and ligand
A 3D viewer of protein ligand allows researchers to visualize and explore the spatial arrangement between a protein and a ligand molecule. It provides valuable insights for drug design and optimization.
Binding mode analysis
The interactions between ligand and receptor represented by different colors depend on the type of force.
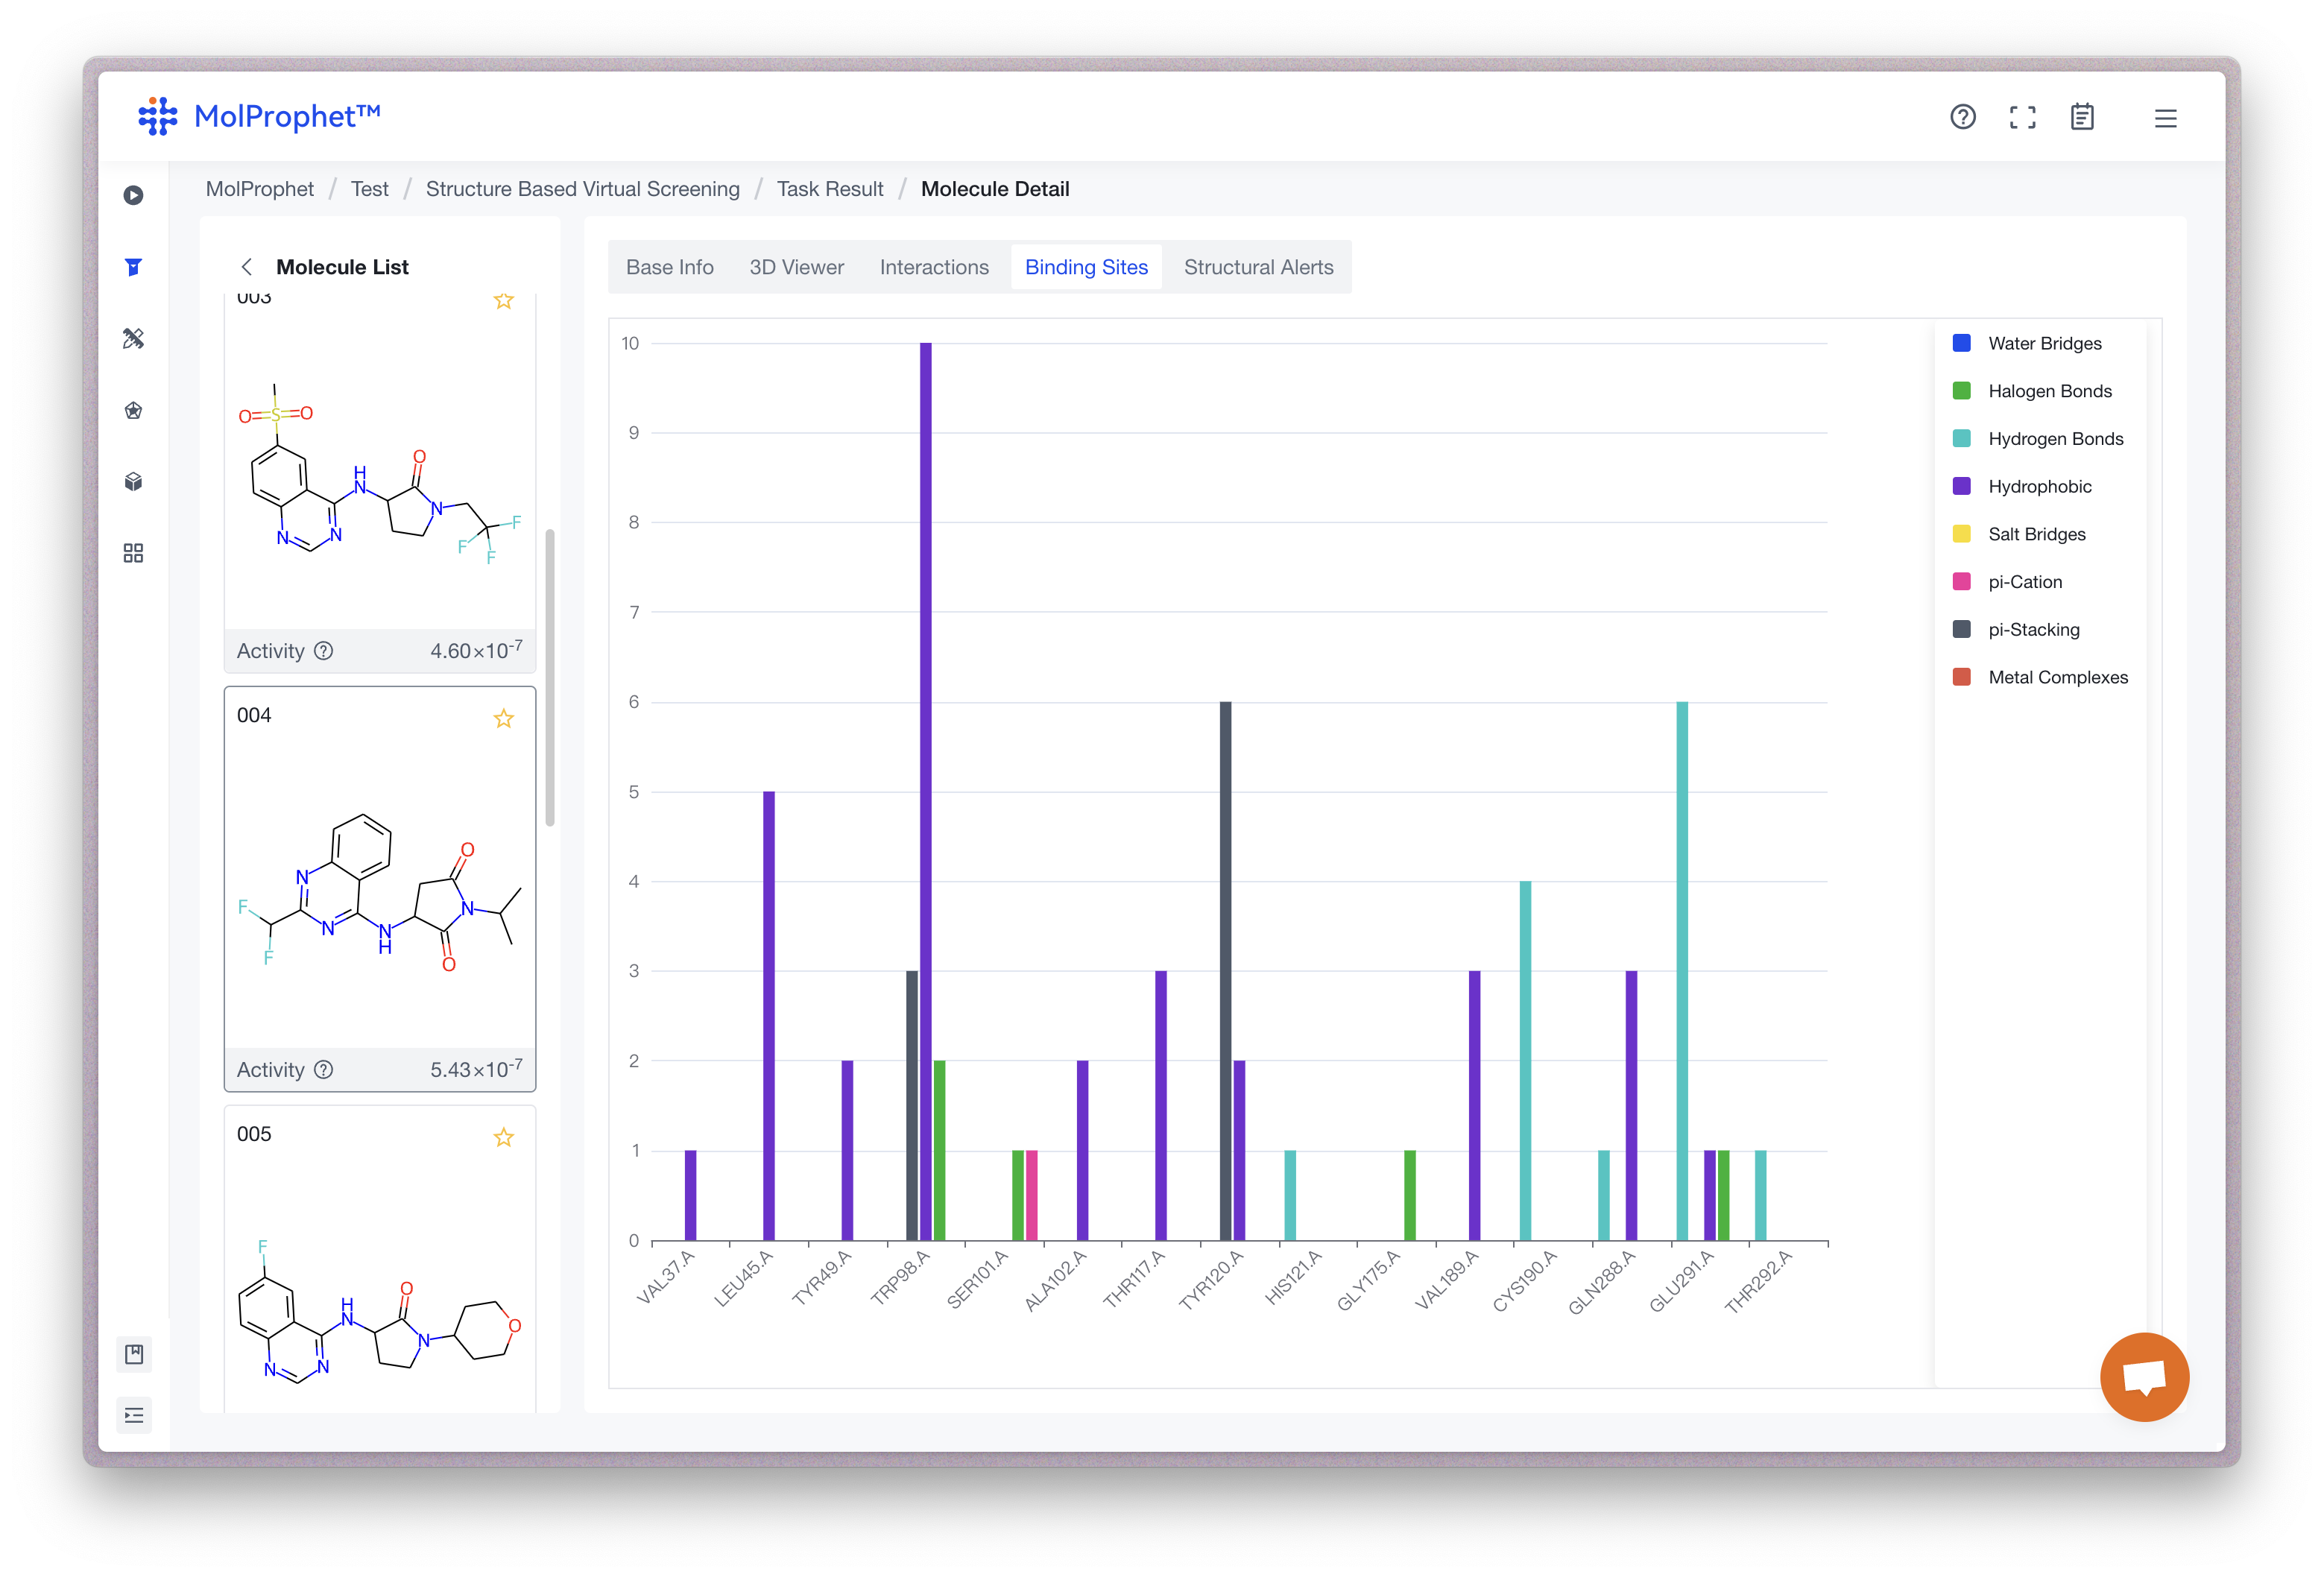
Binding site analysis
Statistical analysis of binding sites for the possible conformations of ligands. The vertical coordinate is the number of ligand conformations predicted by AI, and the horizontal coordinate is the amino acid site; different color statistics correspond to different types of binding forces, and the statistics represent the number of conformations where the current ligand has a binding force with that amino acid site.
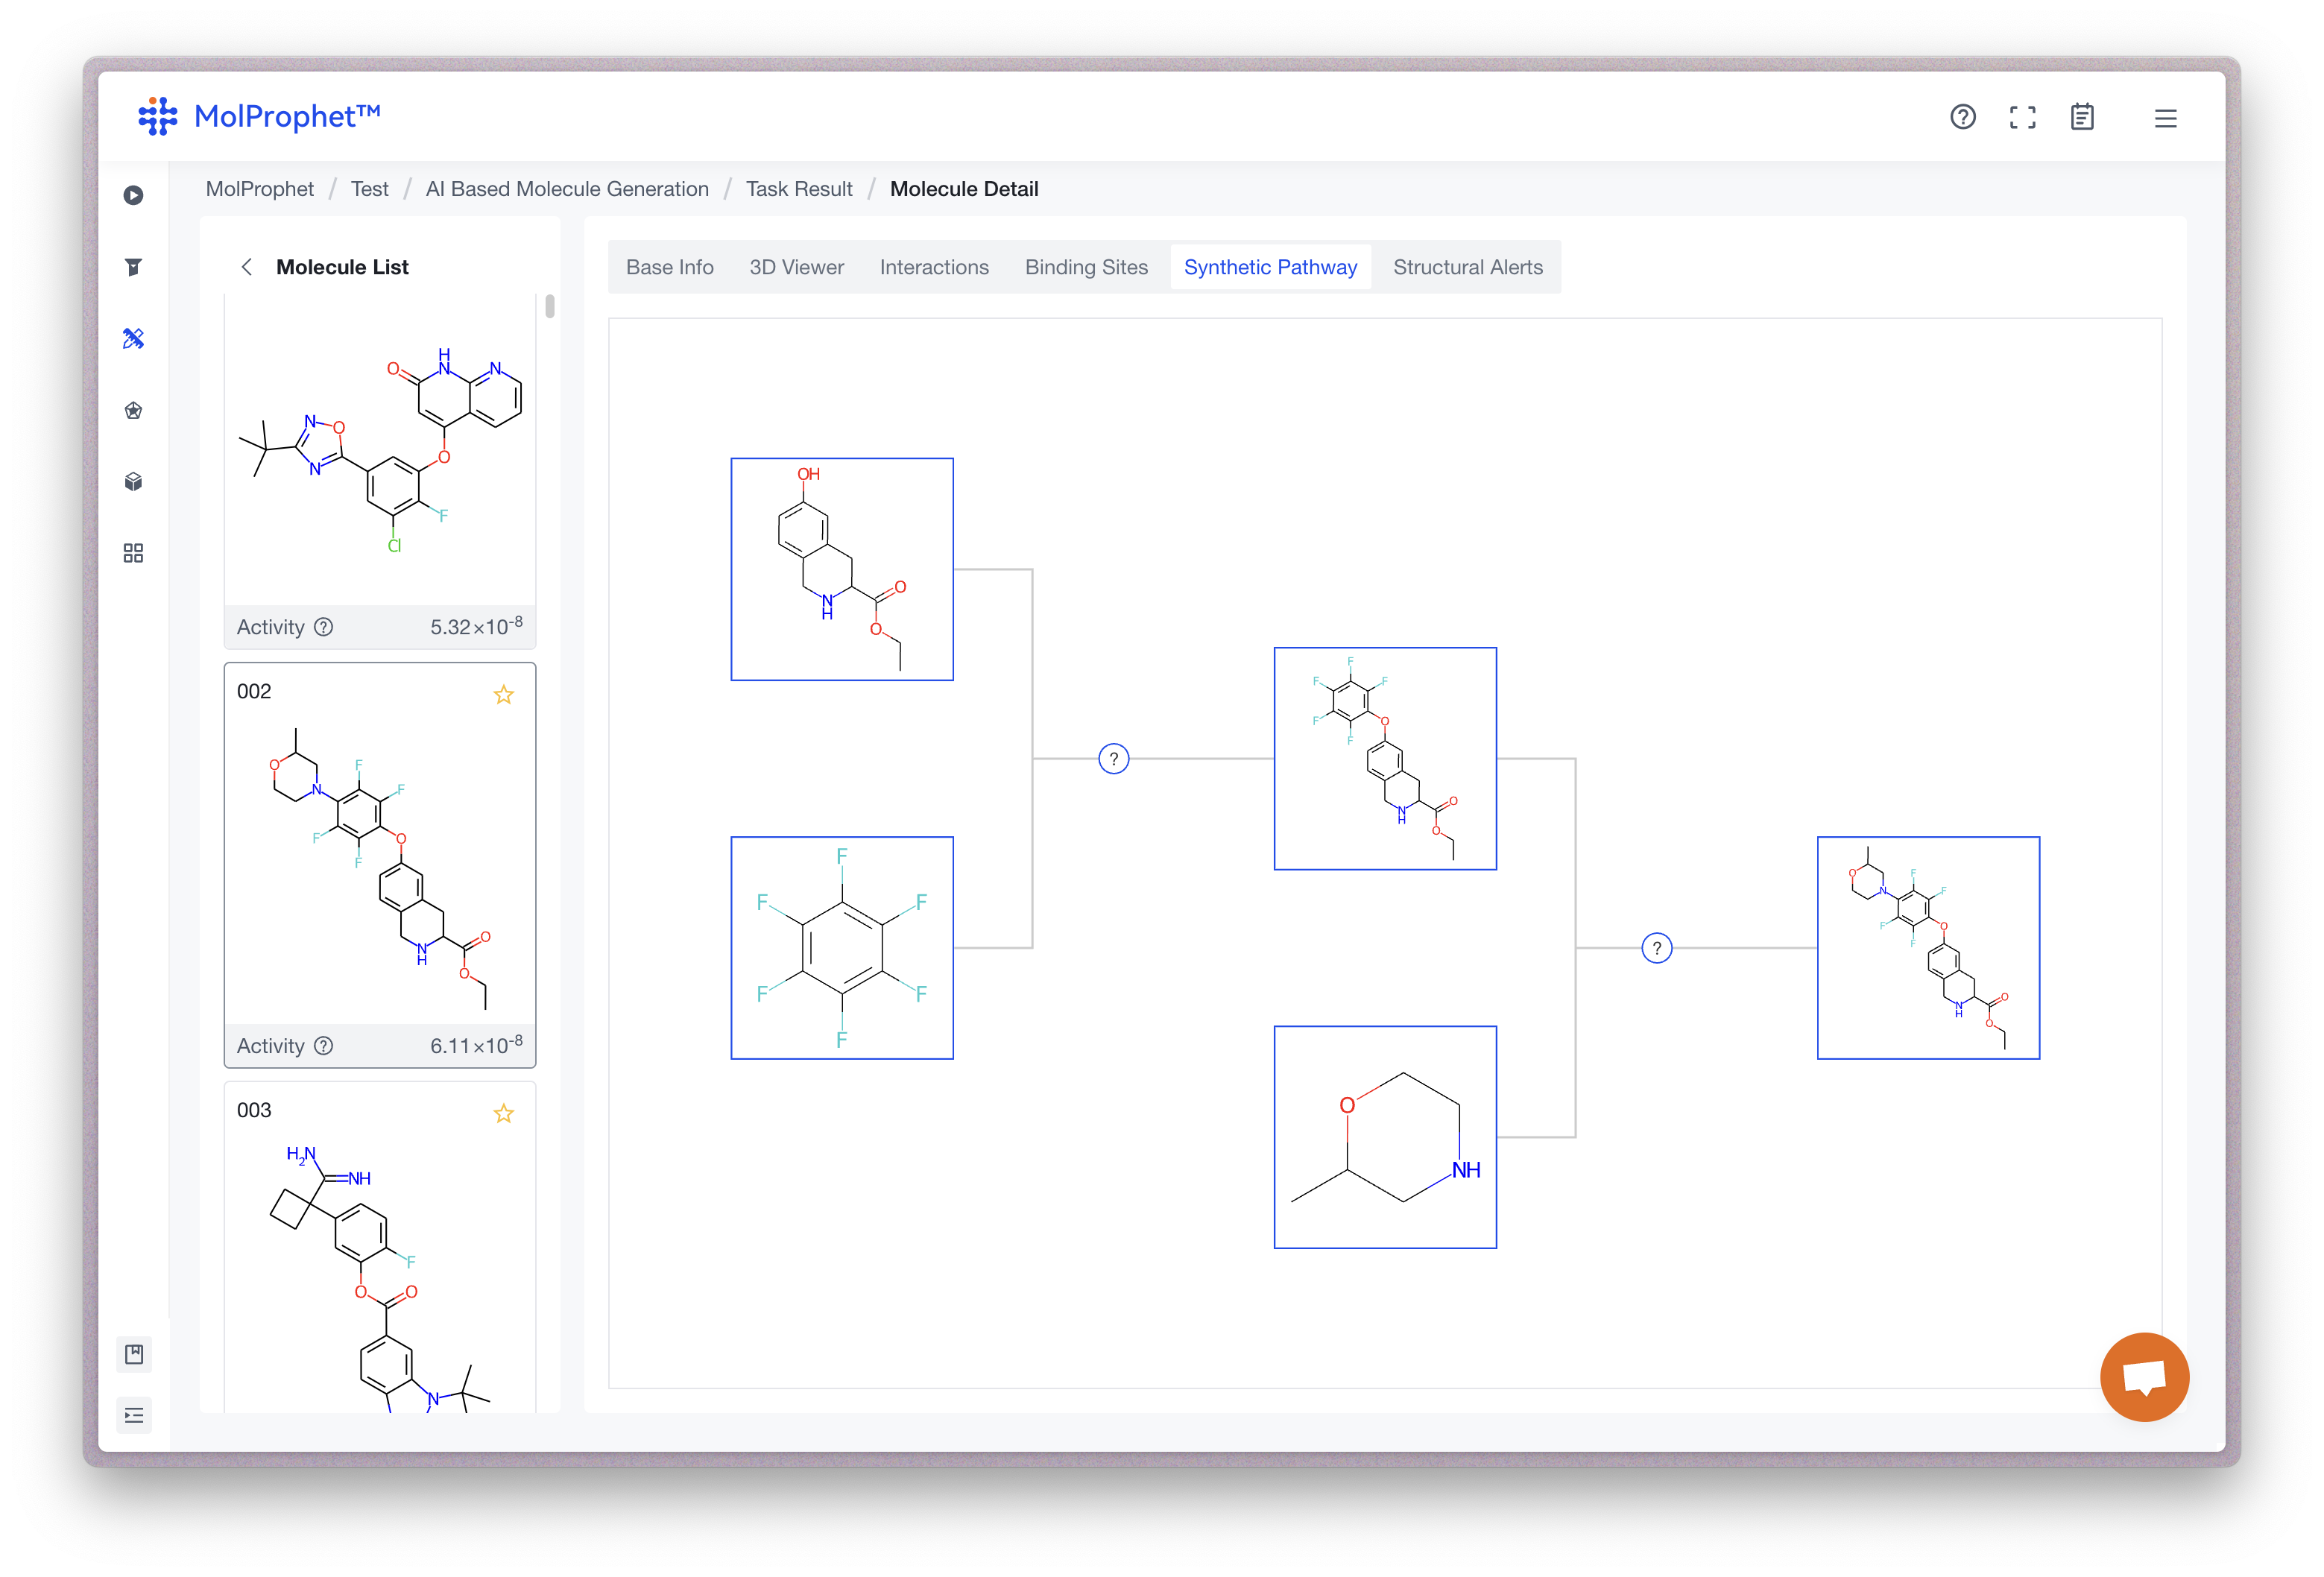
Synthetic Pathway
For AI molecule generation and scaffold hopping task in MolProphet,we provides a reference diagram for the synthetic pathway. Each starting molecule is purchasable. By clicking on the "?" icon in the diagram, you can view the reaction template for that synthesis step. The platform limits the price of the building blocks and controls the number of reaction steps to manage the cost of the scheme. You can refer to the synthetic pathway proposed by the platform to evaluate the difficulty of synthesizing the result molecule.
Structural Alerts
Identifies potential toxicity and risk structures based on known drug rules. Note that this serves as a warning and does not necessarily mean the presence of toxicity or other risks. Sources of rules can be found in the corresponding references.
Chemical Space Navigation
For Molecule Optimization Tasks (including scaffold hopping, fragment optimized growth, and R-group) we provide Chemical Space Navigation at right side of their result pages:
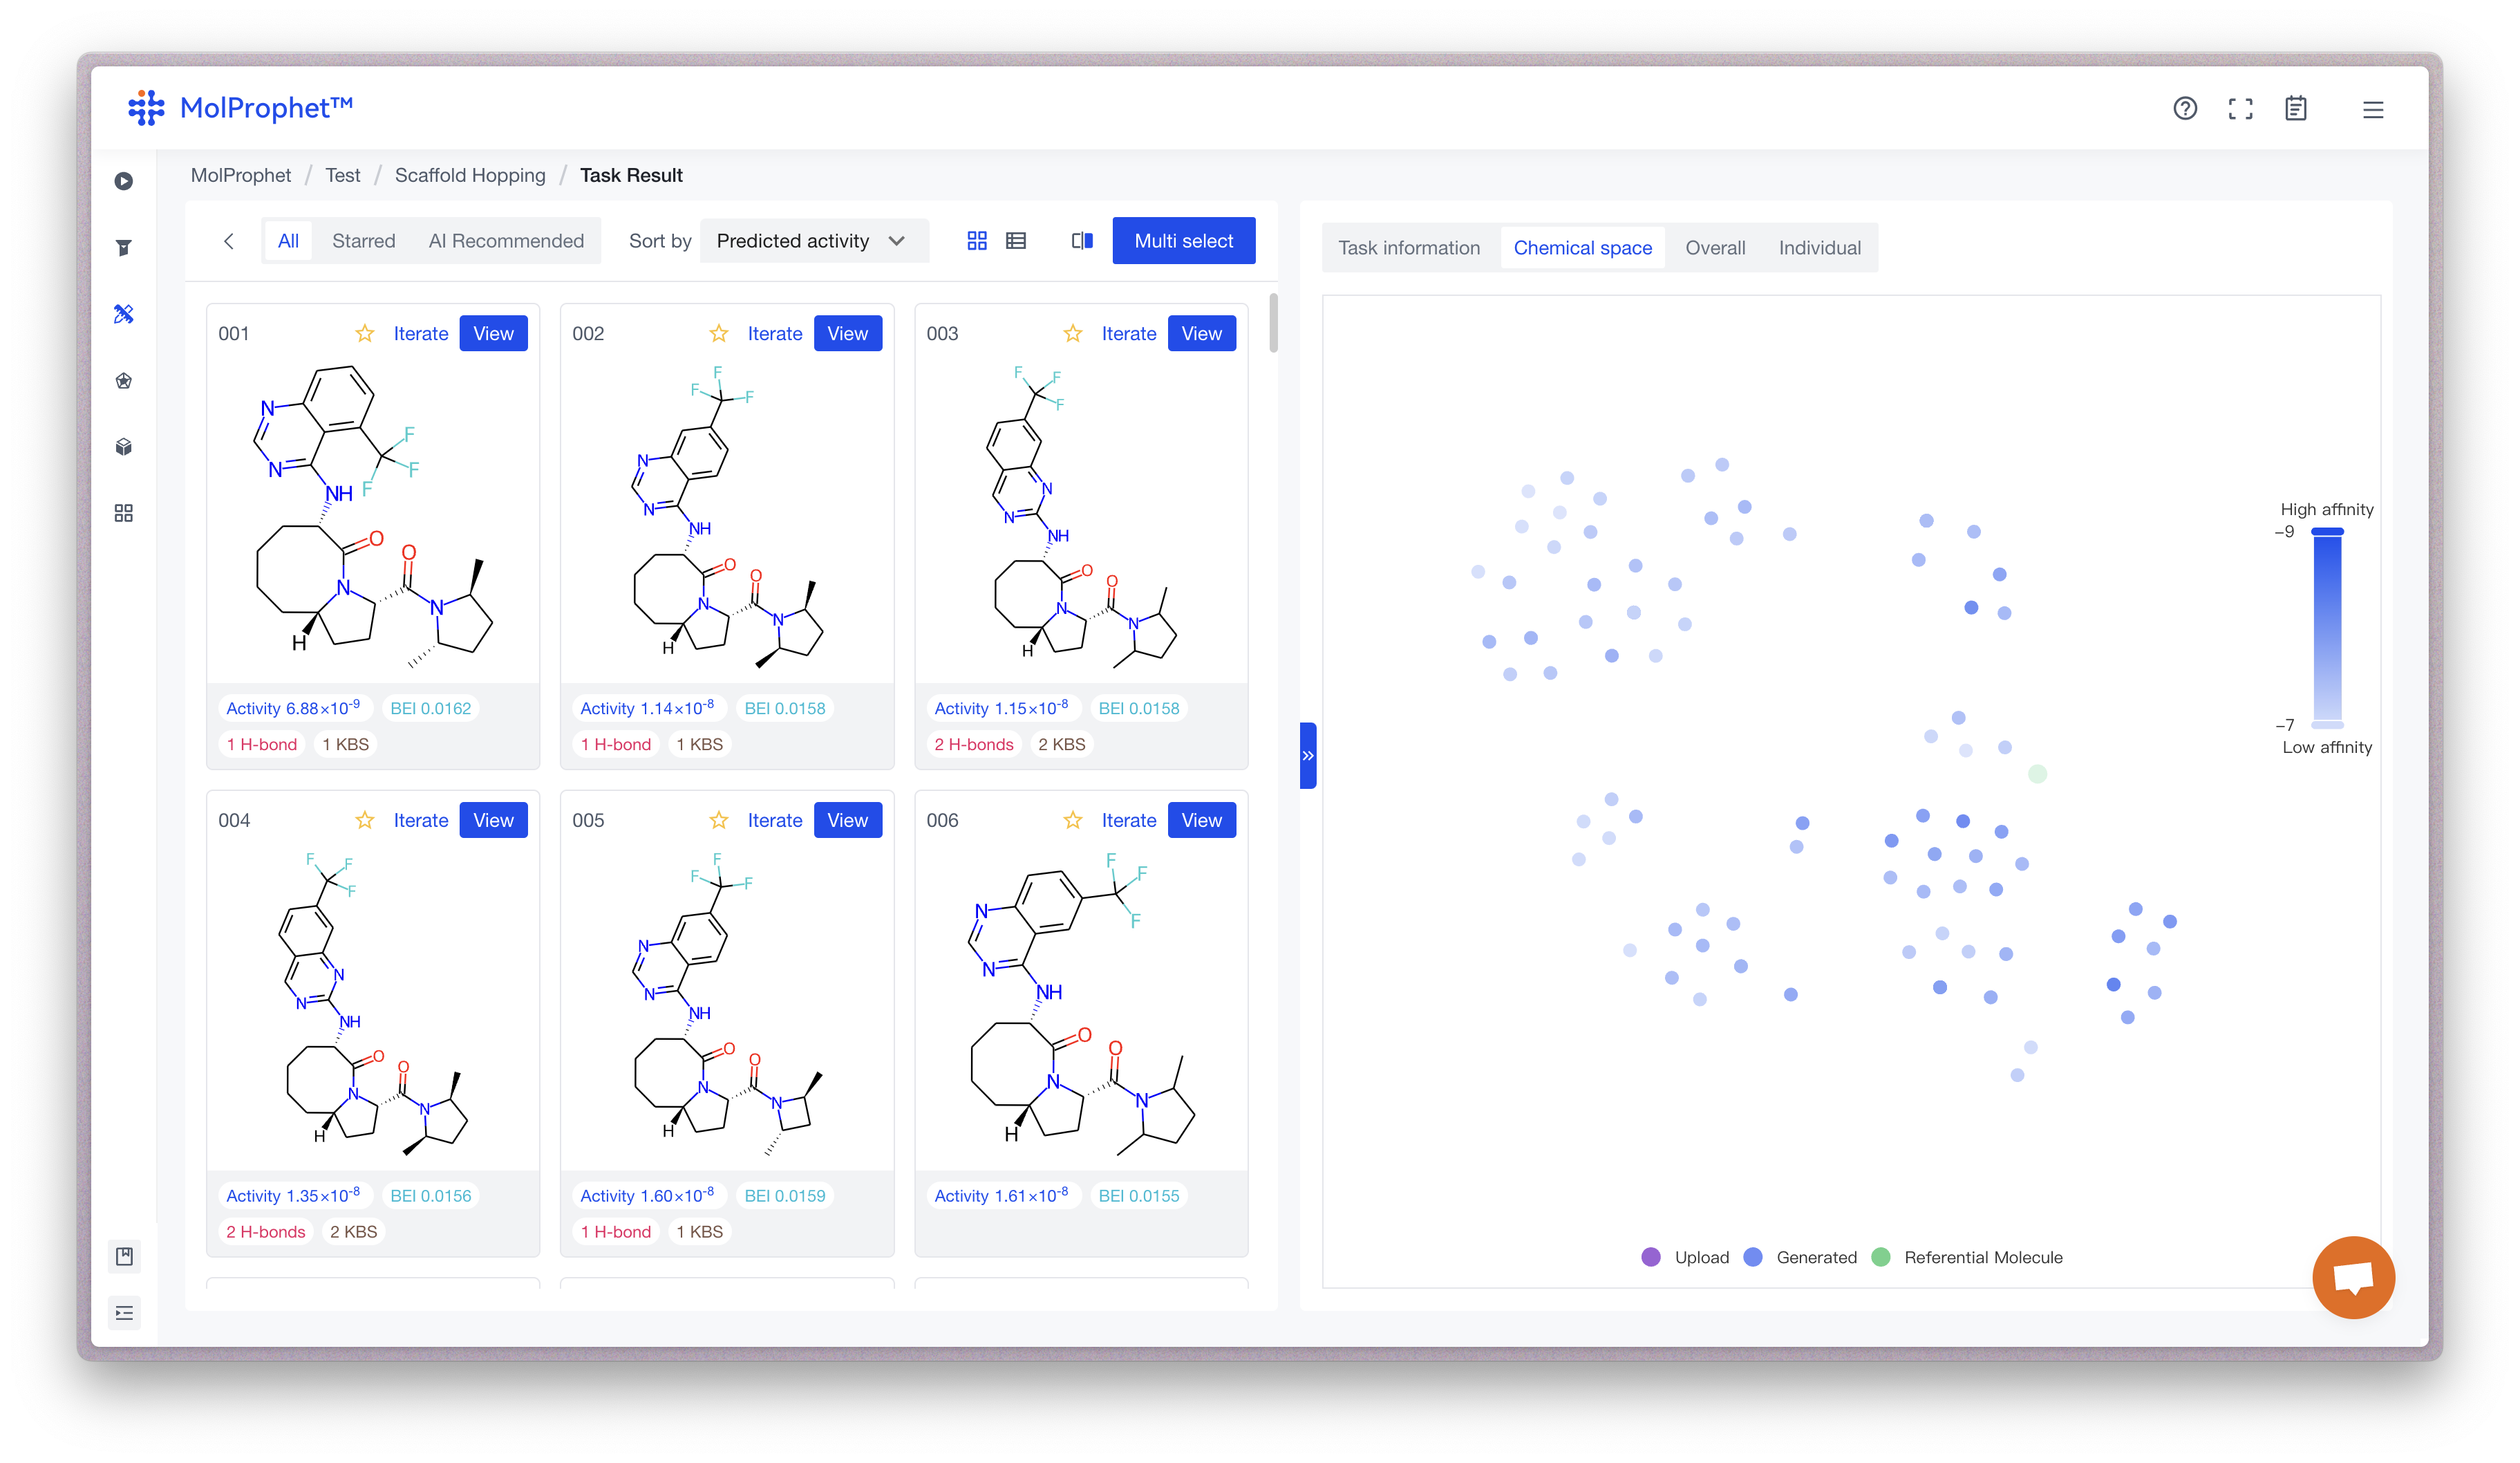
Each point in the chemical space represents a molecule, with different colors representing different types of molecules (generated in this task, historically generated, user uploaded, reference molecules, etc.). Closer points indicate structural similarity, and darker colors indicate higher expected activity. This allows for quick identification of high-activity areas and determination of structural features with high activity potential for further iterative optimization.
Overall & Individual Distribution
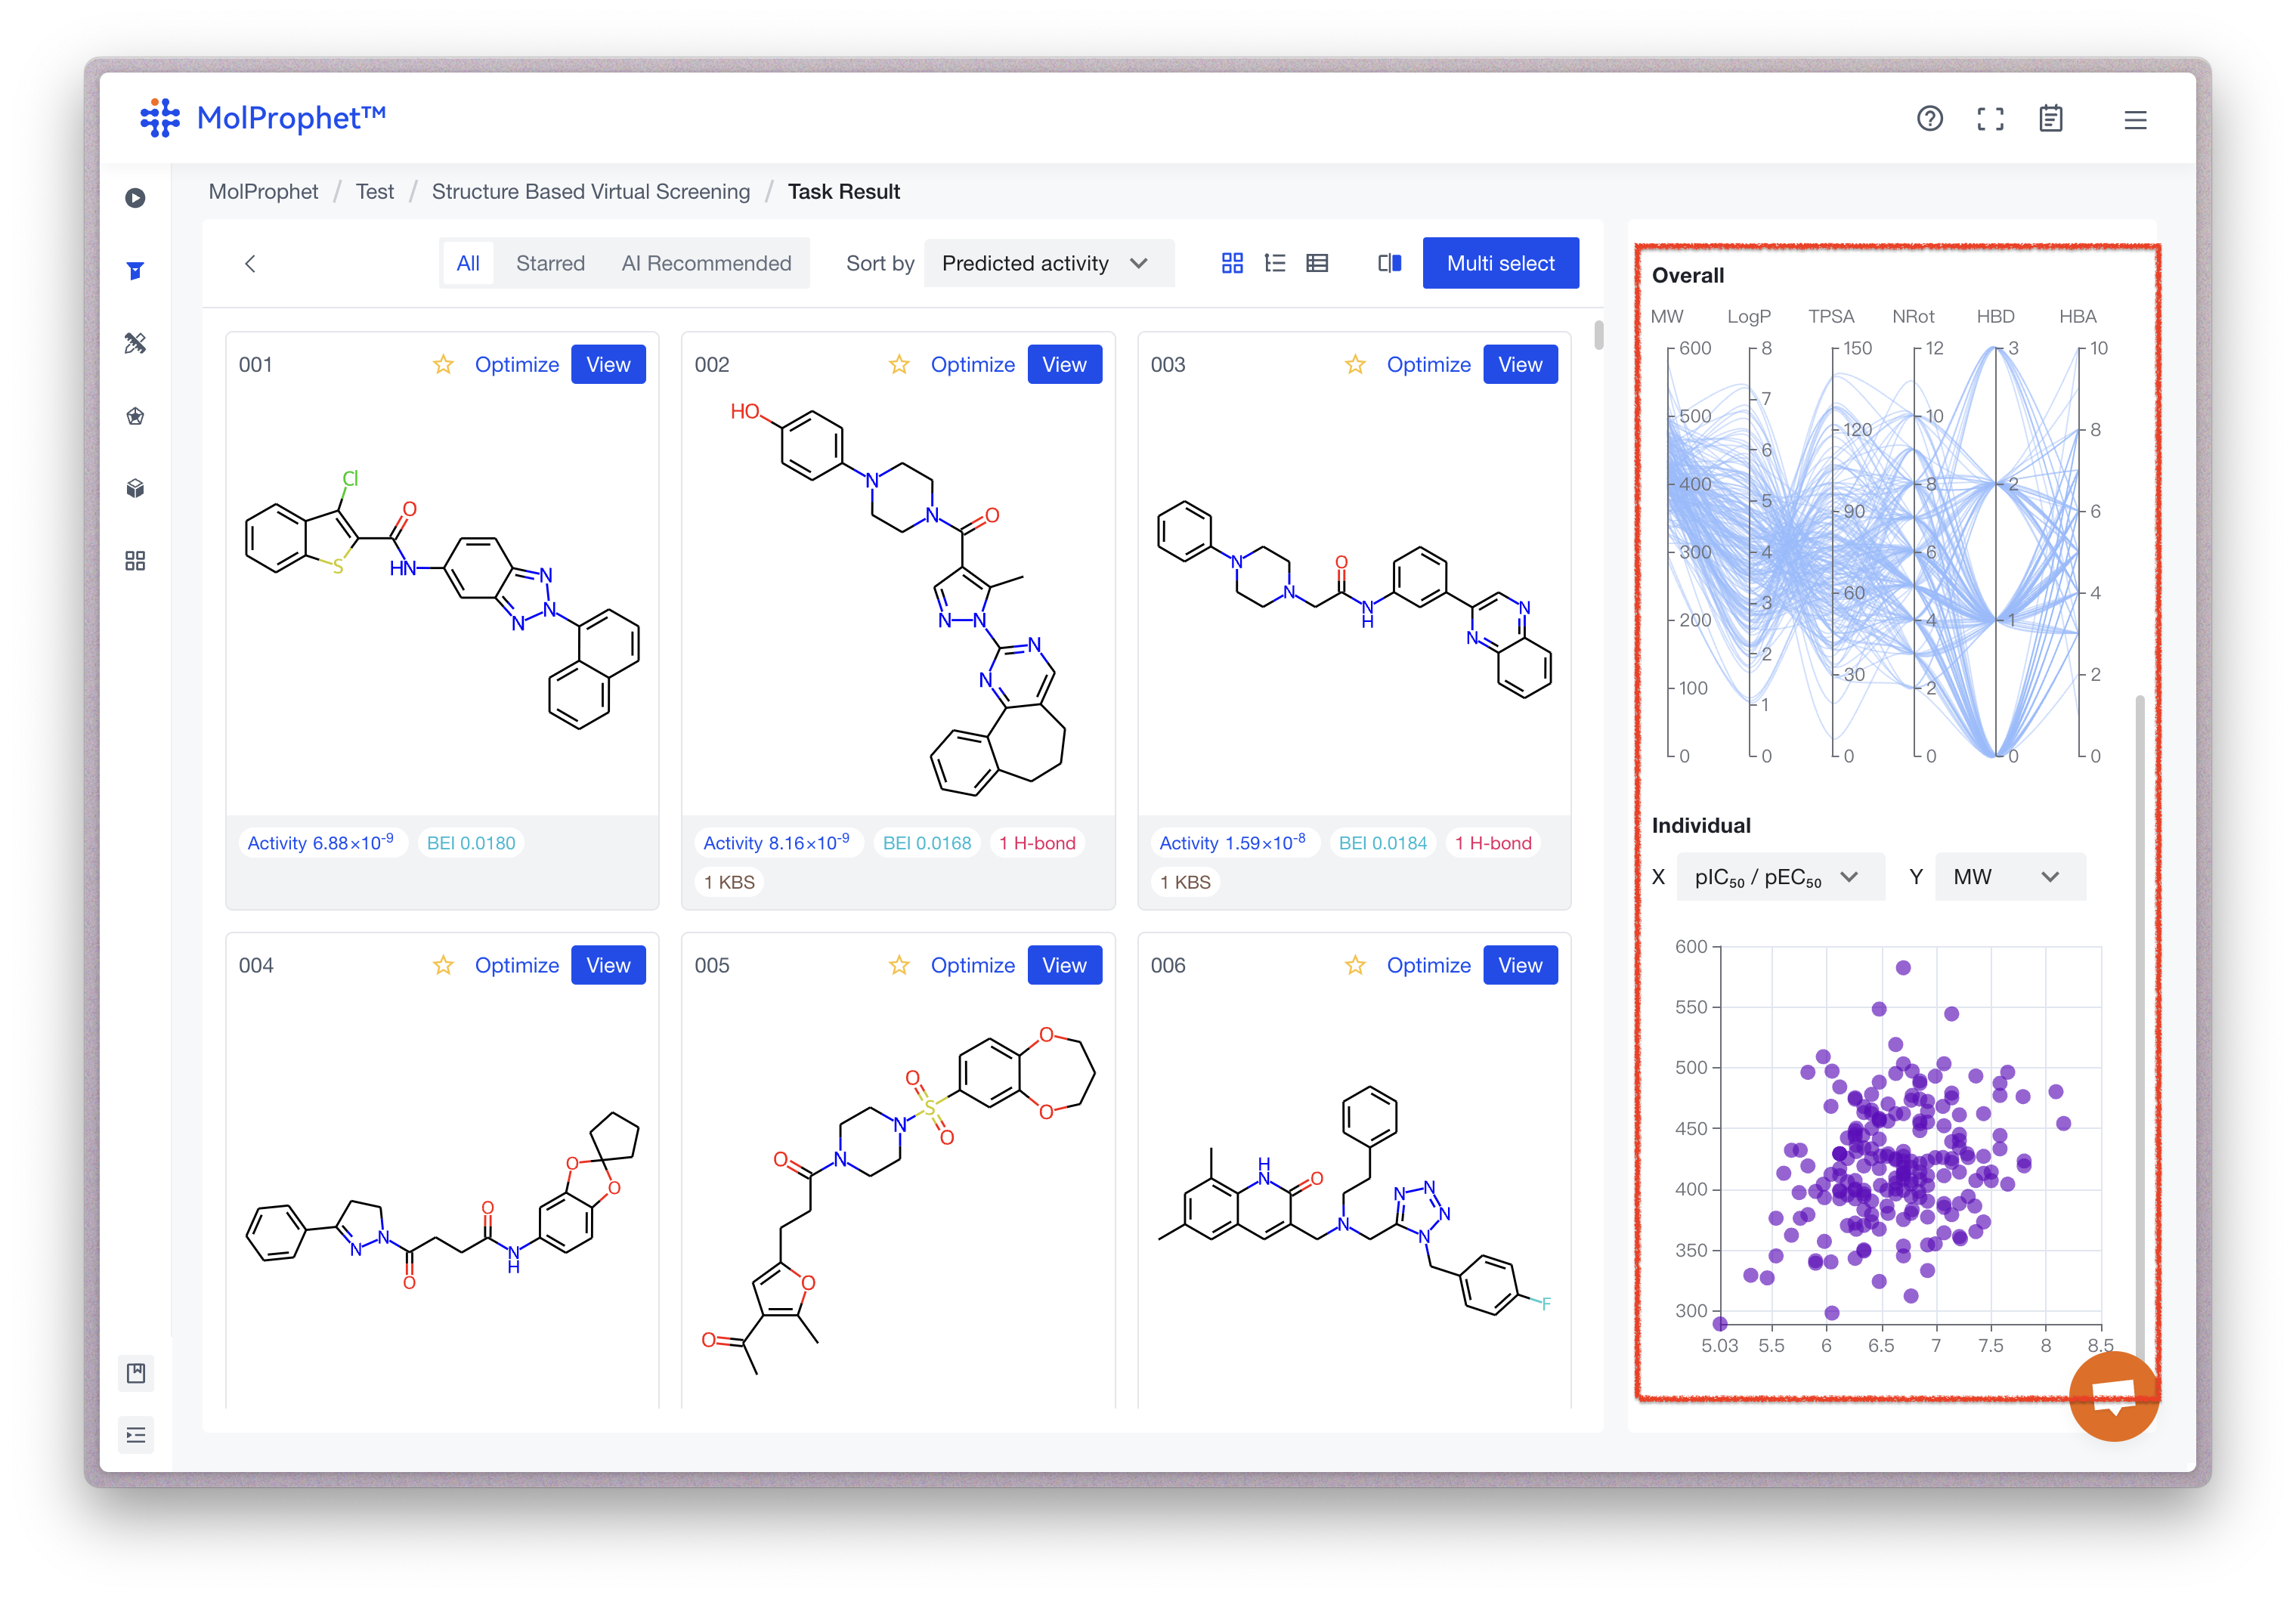
Overall distribution
Summarizes the results of each task into trend distribution graphs. The attribute line corresponding to reference molecules is highlighted in green by default. When selecting any result molecule on the right, the attribute line also highlights in red. You can also quickly filter molecules on the left by selecting attribute ranges in the graph.
Individual distribution
Each point on the graph represents a molecule, and both axes can be adjusted. Users can quickly find molecules with good drug-like properties and high activity or molecules with low molecular weight and good synthetic properties, among other criteria.